Tag Archives: genetics

Mobile EMR, Part IV

This is continuation of Mobile EMR, Part III.

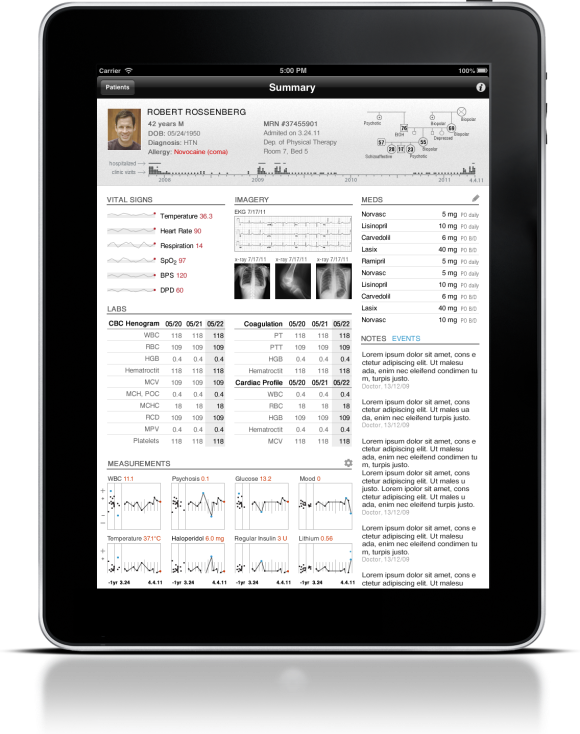
It happened to be possible to fit more information to the single pager! We’ve extended EKG slightly, reworked LABs results, reworked measurements (charts) and inserted a genogram. Probably the genogram brings majority of new information in comparison to other updates.

v4 of mEMR concept

Right now the concept of mobile EMR looks this way…

Mobile EMR v4

Mobile EMR v4

New ‘All Data’ charts

Initially the charts of measured values have been from dots. Recent analysis and reviews tended to connect the dots, but things are not so straightforward… There could be kind of sparkline for the current period (7-10 days). Applicability of sparkline technique to represent data from the entire last year is suspicious. Furthermore, if more data is available from the past, then it will be a mess rather than a visualization, because there is so narrow space allocated for old data. Sure, the section of the chart could be wider, but does it worth it?

What is most informative from the past periods? Anomalies, such as low and high values, especially in comparison with current values. Hence we’ve left old data as dots, previous year data as dots, and made current short period as line chart. We’ve added min/max points to ease the analysis of the data for MD.

Genogram

Having genogram on the default screen seems very useful. User testing needed to test the concept on real genograms, to check the sizes of genograms used most frequently. Anyhow, it is always possible to show part of the genogram as expanded diagram, while keep some parts collapsed. The genogram could be interactive. When MD clicks on it, she gets to the new screen totally devoted to the genogram with all detailed attributes present. Editing could be possible too. While default screen should represent such view onto the genogram that relates to the current or potential diagnosis the patient has.

In the future the space allocated for the genogram could be increased, based on the speed of evolution of genetic-based treatments. May be visualization of personal genotyping will be put onto the home screen very soon. There are companies providing such service and keeping such data (e.g. 23andme). Eventually all electronic data will be integrated, hence MDs will be able to see patients genotyped data from EMR app on the tablet.

DNA Sequence

This is mid term future. DNA sequencing is still a long process today. But we’ve got the technology how to deliver DNA sequence information onto the tablet. The technology is similar to BigImage(tm). Predefined levels of information deliver could be defined, such as genes, exoms and finally entire genotype. For sure additional layers overlays will be needed to simplify visual perception and navigation thru the genetic information. So technology should be advanced with that respect.
Tagged , , , , , , , , , , , , , , , , , , , , , , , , , , , , , , , , , , , ,

Mobile EMR, Part III

This is continuation of previous posts Mobile EMR, Part I and Mobile EMR, Part II

We’ve met with Mr.Tufte and demo’ed this EMR concept. He played with it for a while and suggested list of improvements, from his point of view.

‘All Data’ charts

Edward Tufte insists that sparklines work better than dots. It is OK that sparklines will be of different sizes. It is natural that each measurement has its own normal range. Initially we tried to switch the charts to the lines, but then we rolled back. Seems that we should make this feature configurable, and use sparklines by default. But if some MD wants dots, she can manually switch it in app settings.

Partially our EMR concept has been switched to sparklines – for display of Vital Signs. Below is a snapshot:

Vital Signs

One more thing related to the Vital Signs, we did great by separating on the widget on top, and grouping them together. It adds much value, because they are related to each other. It is important to see what happened to them at each moment. Our approach, based on user testing, appeared to be a winning one!

Space

Current use of the space could be improved even more. First reason is that biggest value of that research was keeping ‘All Information’ on single screen. Human eye recognizes perfectly which type of information is needed. All space is tessellated into multiple locuses of attention. Then human eye locks the desired locus and then focuses within that locus. Second reason is iPad resolution. We can squeeze more from retina resolution without degradation of usability (like size of labels and numbers). It is possible to scale to the newspaper typography on iPad, hence fit more information into the screen estate.

Genogram

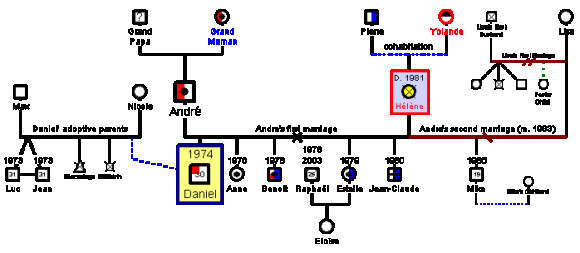
This confirms the modern trend to genetics and genetic engineering. Genogram is a special type of diagram, visualizing patient’s family relationships and medical history. In medicine, medical genograms provide a quick and useful context in which to evaluate an individual’s health risks. Many new treatments are tailored by genotype of the patients. E.g. Steve Jobs’s cancer was periodically sequenced and brand new proteins where applied, to prevent disease spread. All cells are built from the proteins, reading other proteins as instructions. This is true for the cancer cells. Thus if they read instructions from fake proteins, then they can not build themselves properly. We like this idea immediately, because its value is instant and big, its importance is as high as allergy. Below is sample genogram, using special markers for genetically influenced diseases.

Sample Genogram

There are other cosmetic observations which will be improved shortly. We continue usability testing with medical doctors. More to come. It could be Mobile EMR on iPhone. Stay tuned.

UPDATE: Continued on Mobile EMR, Part IV.

Tagged , , , , , , , , , , , , , , , , , , , , , , ,